With data growing per second, many companies face the need of consolidating semi structured data for analysis, data marts or simply to be served to other implementations. Working with semi-structured data can result simple to produce and sometimes hard to ingest. Azure Data Explorer is a great solution to query data hosted in several areas across Azure, including Azure Storage Accounts, Event Hubs and IOT endpoints. The ability to query this kind of data using Azure Data Explorer, provides a quick and easy way to consolidate information hosted already in Azure and keep a data store updated automatically. In this article let’s dig into the basic setup to automate this data ingestion using Azure Storage Accounts, Data Explorer and KQL to query our data.
Azure Data Explorer
Let’s begin by creating an Azure Data Explorer Cluster for Dev/Test purposes. This has one SLA option. If a production cluster was to be created, size, availability and many other options will be added.
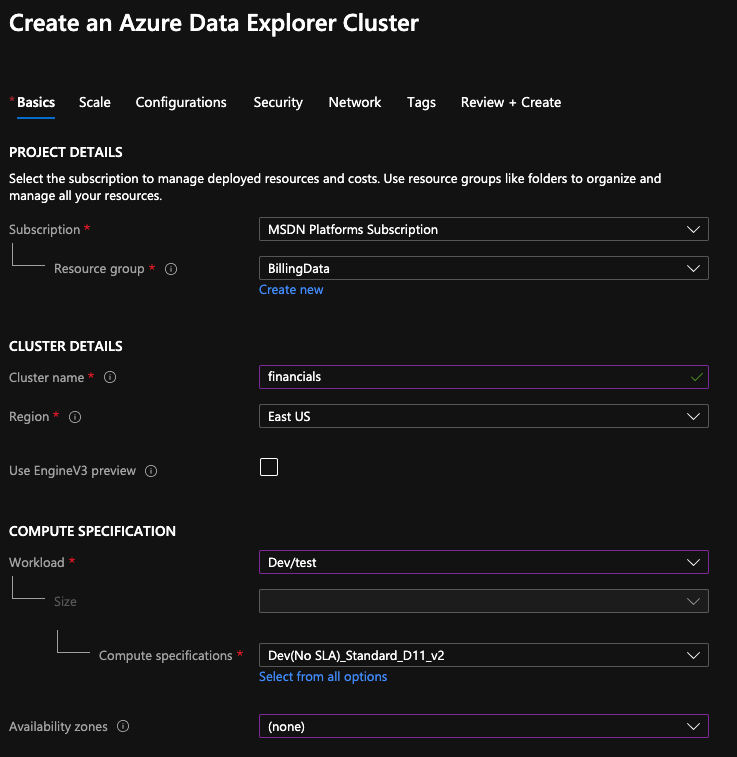
For this article, these is the only tab that will be configured. If you were to use IOT Hub or Event Hub as the source, there will be additional configurations to be made, but these can also be made in the Data Explorer query window. Once the basis tab is done, click review and create. This will take a few minutes to complete.
Let’s create a Data Source
For demonstration, I will use an Azure Storage Account with a basic StorageV2 configuration. I will name it finreports and once the storage account is created, will add a container named monthly-reports on it.
Back to Azure Data Explorer
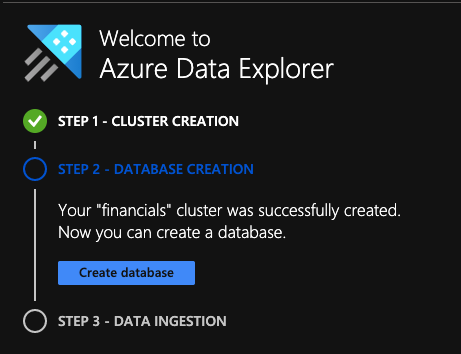
Now that our cluster is ready we can go through the database creation and start setting some data ingestion from our Storage Account. When you navigate to your cluster, the following menu should be available to help you navigate through the basic setup.
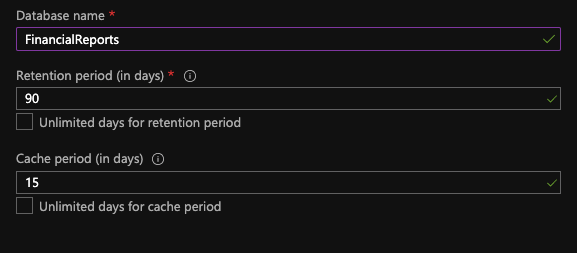
Simply click on the Create database and fill the 3 boxes needed. The retention period specifies, how long do we want to keep the data ingested in our cold database and the cache period, specify for how long this data will be in hot cache. Data not in cache will take longer to retrieve, but be careful when managing cache since it can get very expensive to maintain higher volumes in a hot partition. Once it’s all set, click create database.
Now that the database is created, let’s get our table and mappings created. In order to create the table to be populated, go Query and run the following KQL script.
Table Creation
.create table ['MonthlyFinancialReports'] (
['BalanceID']:guid
, ['BalanceDate']:datetime
, ['Balance']:real
, ['isPaidOff']:bool
, ['FirstName']:string
, ['LastName']:string
, ['StreetAddress']:string
, ['City']:string
, ['ZipCode']:string
)
Mappings
Mappings are essential when migrating data from JSON files or any other semi-structured data files format. This will tell Azure Data Explorer which value on the file belongs to which column on the table. These mappings will be used when creating a connection between Storage and Cluster. The following KQL will create the mapping from the JSON file we will use, to the table we just created. At this point, no transformations are done, but we could change a column name or apply other transformation during the mapping definition.
.create table MonthlyFinancialReports ingestion json mapping "MonthlyFinancialReports_JSON_Mapping" '[{"column":"BalanceID","path":"$[\'BalanceID\']","datatype":"guid","transform":null} ,{"column":"BalanceDate","path":"$[\'BalanceDate\']","datatype":"datetime","transform":null} ,{"column":"Balance","path":"$[\'Balance\']","datatype":"real","transform":null} ,{"column":"isPaidOff","path":"$[\'isPaidOff\']","datatype":"bool","transform":null},{"column":"FirstName","path":"$[\'FirstName\']","datatype":"string","transform":null},{"column":"LastName","path":"$[\'LastName\']","datatype":"string","transform":null},{"column":"StreetAddress","path":"$[\'StreetAddress\']","datatype":"string","transform":null},{"column":"City","path":"$[\'City\']","datatype":"string","transform":null} ,{"column":"ZipCode","path":"$[\'ZipCode\']","datatype":"string","transform":null}]'Connecting Storage to ADX
As of now, a table and some mappings have been created. Now let’s go thru the process of connecting our Blob Storage to this table that we just created. On your ADX overview, click on Databases and select the previously created DB, then on your sidebar click on Data Ingestion and then click Add Data Connection.
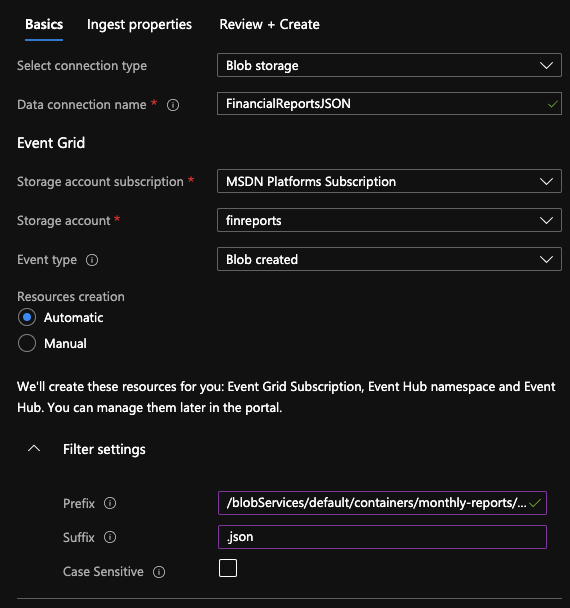
On Filter settings there are 2 very important boxes to fill.
Prefix: /blobServices/default/containers/monthly-reports/blobs/financialreports
Suffix: .json
On the Prefix, the syntax is as follow: /blobServices/default/containers/[container]/blobs/[file-prefix]. This is key on filtering an obtaining the right files from the container. Once those 2 boxes are completed, click on Ingest Properties.
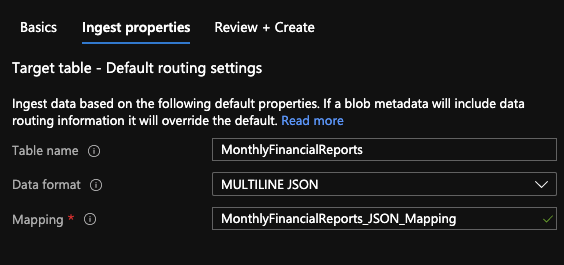
On the ingestion properties, the information about the Table and Mapping that we just created is needed along the data format which in this case will be MultiLine JSON. Many formats are compatible including Parquet, CSV, Avro among others. When done, click Review and Create. This process will create an Events Hub session targeted for Blob Creation events on your Azure Storage account. Every time a matching file is created on the storage account, the data on it will be ingested according to the mapping and caching settings specified. At this point, we should have an Azure Storage Account, And ADX Cluster and a Event Hubs Namespace (Ingest Connection)
Let’s generate some data…
For this exercise, I developed the following script to generate some fake data in JSON files. I used Python with Faker and Pandas libraries. This will generate monthly reports from January thru October of 2020 for a range of 5k-10k transactions per month. Each JSON stored in its own file with the prefix we established on the Ingestion process.
import pandas as pd
import random
import uuid
from faker import Faker
from datetime import datetime
fake = Faker(['en-US'])
periods = {'startdate': ['01-01-20','02-01-20','03-01-20','04-01-20','05-01-20','06-01-20','07-01-20','08-01-20','09-01-20','10-01-20'], 'endDate':['01-31-20','02-29-20','03-31-20','04-30-20','05-31-20','06-30-20','07-30-20','08-31-20','09-30-20','10-24-20']}
periodDF = pd.DataFrame(data=periods)
BalanceTable = pd.DataFrame(columns=['BalanceID', 'BalanceDate', 'Balance', 'isPaidOff',
                                        'FirstName', 'LastName', 'StreetAddress', 'City', 'ZipCode'])
for index, row in periodDF.iterrows():
    startDate = datetime.strptime(row['startdate'],'%m-%d-%y')
    endDate = datetime.strptime(row['endDate'],'%m-%d-%y')
    BalanceTable.drop(BalanceTable.index, inplace=True)
    BalanceTable.set_index(['BalanceID'])
    randomRange = random.randint(5000,10000)
    for row in range(randomRange):
        FirstName = fake.first_name()
        LastName = fake.last_name()
        StreetAddress = fake.street_address()
        City = fake.city()
        ZipCode = fake.zipcode()
        isPaidOff = fake.boolean(chance_of_getting_true=75)
        Balance = float("{0:.2f}".format(random.uniform(0, 10000)))
        BalanceDate = str(fake.date_between(start_date=startDate, end_date=endDate))
        BalanceID = str(uuid.uuid1())
        BalanceTable = BalanceTable.append({'BalanceID': BalanceID, 'BalanceDate': BalanceDate, 'Balance': Balance, 'isPaidOff':isPaidOff, 'FirstName': FirstName,'LastName': LastName, 'StreetAddress': StreetAddress, 'City': City, 'ZipCode': ZipCode}, ignore_index=True)
    FileName = 'financialreports_{0}_{1}.json'.format(str(startDate),str(endDate))
    BalanceTable.to_json(FileName,orient='records')
The output
{
        "BalanceID": "8eae24de-1702-11eb-a196-faffc239121b",
        "BalanceDate": 1580688000000,
        "Balance": 5016.21,
        "isPaidOffFirstName": null,
        "LastName": "Knox",
        "StreetAddress": "3940 Christina Plaza Apt. 097",
        "City": "Brittanyland",
        "ZipCode": "00811",
        "FirstName": "Teresa",
        "isPaidOff": 1.0
}
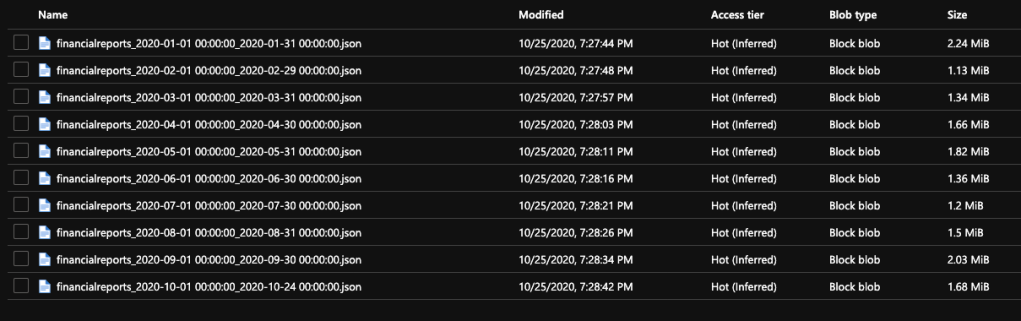
I’ve uploaded 10 JSON Files to the Azure Storage Account container. In a few minutes, this data will be available to be queried, analyzed and shared using KQL (Kustos Query Language)/
Querying Data
In about 5 minutes, data was ready to be read and to start creating views and reports for it. The following query, summarizes data per file uploaded with the SUM of the balance column. In order to query the data in ADX, Kustos Query Language (KQL) is used. This is a fairly simple yet powerful language that not only allows us to query the data, but also to render it in graphs directly from the Query Engine. On a first time query the equivalent of a Select * from Table took 2.73 seconds to retrieve 70,370 records with a 2vCPU node.
MonthlyFinancialReports
| summarize MonthTotal = round(sum(Balance),2)
, Transactions = count(BalanceID)
by MonthOfYear = monthofyear(BalanceDate)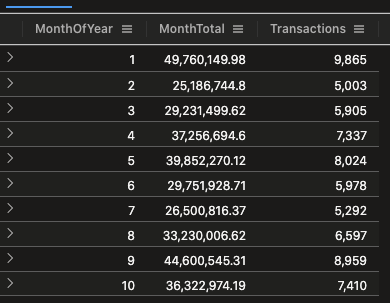
Balances per Month
This sample query returns a Stacked Bar Chart of the Paid and Unpaid balances per month.
MonthlyFinancialReports
| project MonthOfYear = monthofyear(BalanceDate), Balance, BalanceStatus = iif(isPaidOff == true,"Paid","UnPaid")
| summarize MonthlyBal = round(sum(Balance),2) by MonthOfYear, BalanceStatus
| evaluate pivot(BalanceStatus ,sum(MonthlyBal))
| render barchart kind=stacked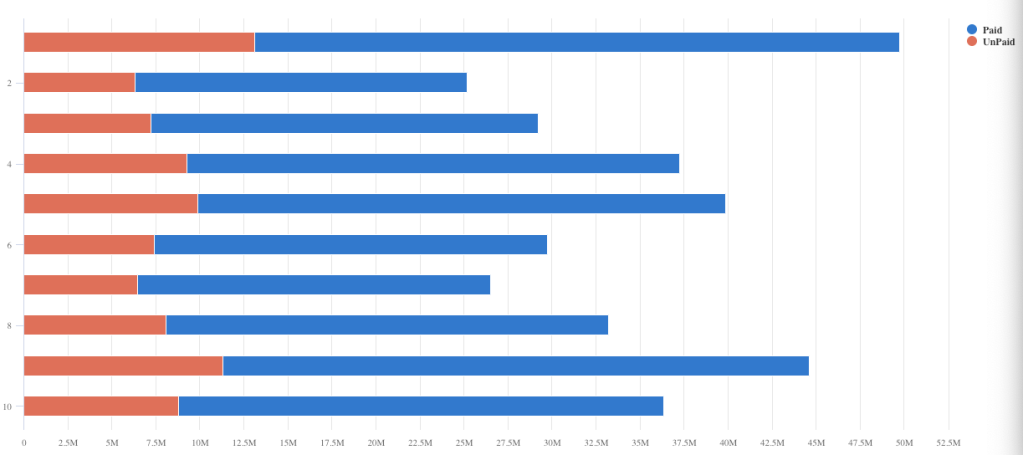
PowerBI
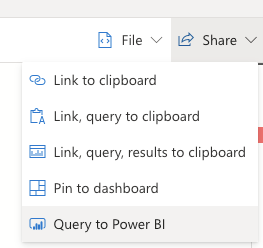
Now lets bring that query to PowerBI. On the query window, click Share and select PowerBI.
In PowerBi click on Get Data, then Blank Query and paste the Kustos query that was generated and copied to your clipboard. You may need to re-authenticate in PowerBI
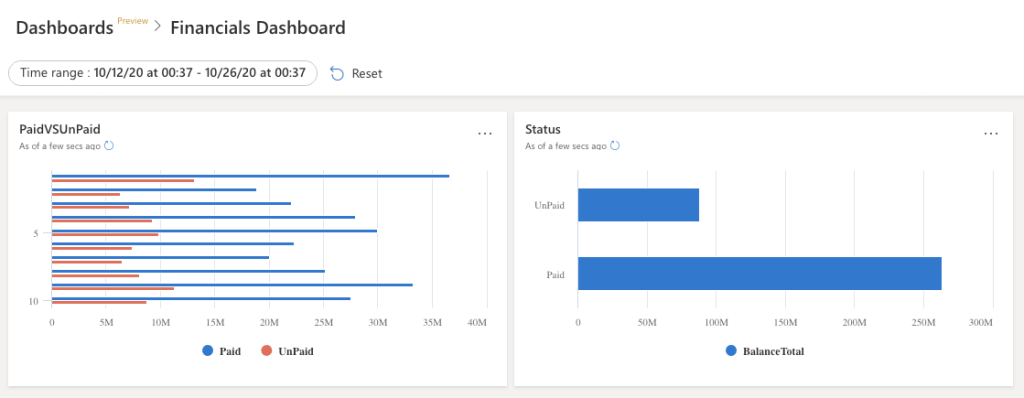
Native Dashboards
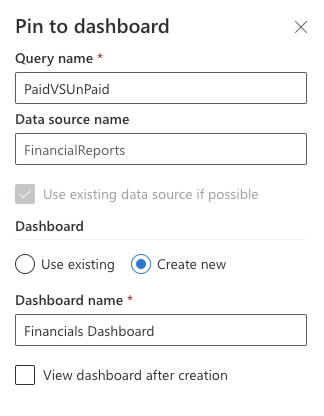
You may create a dashboard of your queries and access it directly via web. Simply click on the share button and select pin to dashboard. If you don’t have a dashboard create a new one or simply add to an existing.
Conclusion
Azure Data Explorer, Storage Accounts and KQL are a great combination to automate semi-structured data consolidation. It takes about 1 hour to setup and automate a data pipeline and with great and elastic performance. Also, when used for production, the power of ADX can scale up and down to tackle big queries and process TBs of data. KQL is also a great language to understand and process azure operating data.
